
Jan 29, 2025
Dam Safety Researchers Probe Paleoflood Data
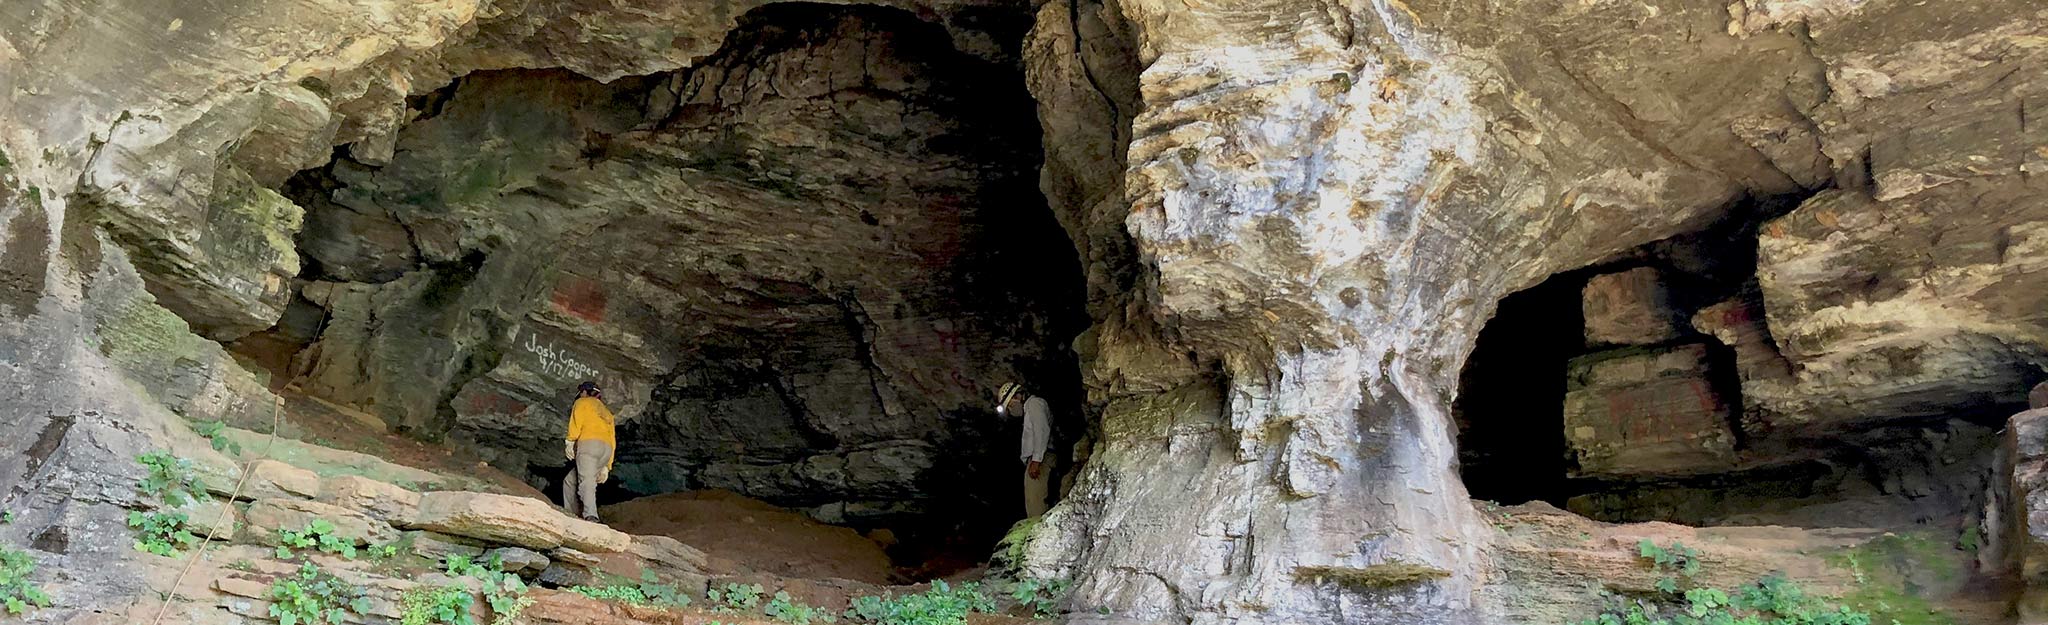
University of Alabama researchers scout for paleoflood sediments in a cave along the French Broad River above Douglas Reservoir. Large floods can inundate caves and rock shelters, which preserve evidence. (Photo by Dr. Lisa Davis / University of Alabama)
Over thousands of years, rivers in the Valley region have shaped the landscape.
Tumbling from the foothills, they carved tight turns where roads now wind. Flowing slow in the lowlands, they formed navigable waterways and fertile farmland.
While these rivers made the region an ideal place to live, work and play, throughout history they also posed tremendous risks to people through extreme floods.
How bad did those past floods get? How often, when and where did they happen? And will the region be prepared for extreme floods in the future?
Enter Tennessee Valley Authority’s Dam Safety and River Management teams.
Working with partners from the U.S. Geological Survey, University of Alabama and University of Memphis, TVA engineers peered far back into history – thousands of years – to analyze evidence from paleofloods.
What they found in caves and riverbanks revealed how extreme past floods were – and could be – and helped them ensure TVA’s dams and nuclear plants will withstand future storms.
“We know that these floods are going to happen,” Miles Yaw, civil engineer in TVA River Management, said. “Understanding flood frequency is essential to managing risk. The bigger the flood is, the farther away it is in history… the more effective it’s going to be at estimating our flood frequency going forward.”
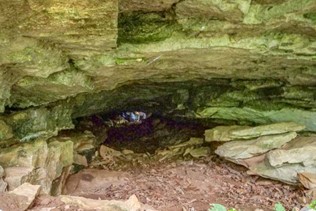
Sediments inside this cave near Florence, Alabama, date back several thousand years and help TVA understand flood frequency on the lower Tennessee River. (Photo by Miles Yaw / TVA)
The Story Sediment Tells
Searching for extreme, ancient paleofloods takes time and effort.
Written and stream gauge records in the Tennessee River system go back about 200 years.
Data from the 1867 Chattanooga flood of record – and the 38 more times Chattanooga flooded, until Norris Dam’s gates closed in 1936 – guided TVA engineers in building the dams that exist today.
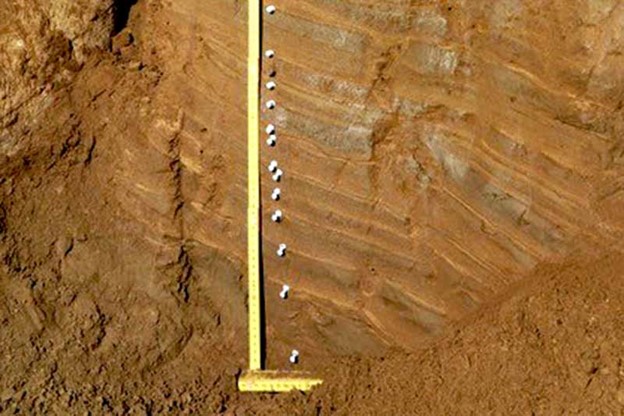
But to find floods from hundreds or thousands of years ago, scientists need to read the story written in the sediment – the layers of soil and minerals the river left on the landscape.
“Floods, especially very large floods, leave evidence,” Yaw said. “It shows up in thin parallel layers.”
Minerals – such as tiny, sparkly flakes of mica – in those layers give clues, too.
“The only way that you would have abundant mica in the sands on the floodplain is by a Tennessee River flood that carried it from the Smokies,” Yaw explained.
Dark lines from sediment staining and huge boulders that tumbled along in the flood also give clues, but overall, it’s tough to spot flood evidence in the lush forests of the Southeast.
TVA and the university research team searched the forested soils of terraces and scrambled into rock shelters and caves high on bluffs overlooking rivers. These shelters fill with water only in the rarest, highest floods.
In Parches Cove and Painted Bluff near Guntersville Reservoir, and two caves near Florence, Alabama, they found mica flakes and other sandy sediment from major floods.
“You can sample the sediment and get an idea of the size of the flood that put the material there,” Yaw said. “But you don’t just need the size. You also need a date.”
Scientists use carbon dating and optically stimulated luminescence – shining light on material that’s been in the dark – to find out when floods flowed through.
“The 1543 flood that we found at Guntersville is in journal records from DeSoto, when he was traipsing across the Southeast United States,” Yaw said. “It’s pretty cool to find that flood.”
Their research extended the flood record even further, showing huge floods that happened 8,000 and 11,000 years ago at different sites.
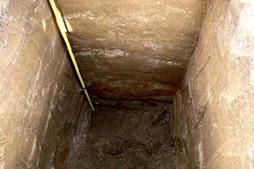
Thin, parallel layers of sediment in the entrance to Ocoee Cave tell a history of floods on the Ocoee River. (Photo by Alan Cressler / U.S. Geological Survey)
Tens of Thousands of Storms
Finding flood evidence is step 1. Step 2 is adding it to computer models to work some statistical magic.
Yaw explained how flood prediction models work.
“Take a storm that has happened historically, move it to where you’re concerned about it, scale it up to the size that you are interested in, and then let it rain,” Yaw said. “Do that over and over and over again, with tens of thousands of storms, and you end up with a probability curve.”
That probability curve shows the likelihood of a major flood at different rivers in the Valley region – without having to experience those extreme events.
Adding paleoflood data helps calibrate the results.
While researchers can’t see how much it rained in the distant past, they can input paleoflood data to see how fast the river roared in its channels and how high the water reached.
Then, they compare the range of actual flood levels with what the model had predicted.
Adding paleoflood data helped researchers confirm the models had accurately estimated flood risk.
And they confirmed that TVA’s dams would stand strong, protecting communities downriver.
“This is a really good tool for improving our understanding of flood risks,” said Jeffrey Munsey, manager of TVA Dam Safety’s risk and emergency safety preparedness group.
Thin, parallel layers of sediment in the entrance to Ocoee Cave tell a history of floods on the Ocoee River. (Photo by Alan Cressler / U.S. Geological Survey)
‘Extraordinary Event’
TVA hydrology models, with the help of paleoflood data, had predicted that a large, land-based hurricane over the Smoky Mountains could cause widespread, catastrophic flooding.
Then came Hurricane Helene.
“We model and plan for those extreme storms, and here we’ve had one,” Munsey said. “We had tools in place that prepared us for what to look for and how to respond.”
In areas downstream of TVA dams, rivers didn’t cause as much damage as they would have without the dams. But the undammed tributaries raged and destroyed lives.
“It was so much rain over such a large area,” Yaw said. “It’s not every day that a storm can create the flood of record on so many large rivers.”
Throughout western North Carolina and east Tennessee, many rivers – the Pigeon, Doe, Nolichucky, Watauga and French Broad – reached record water levels at once.
“That’s a massive storm – 8,000 square miles got (at least) 9 inches of rain,” Yaw said. “That’s a quarter of the Tennessee River watershed, almost. It’s that sort of regional context that made it such an extraordinary event.”
Adding these extreme events – both modern and paleo – matters, because time erases collective memory of them.
“You get a hundred and some years later, and people forget about the 1916 flood in Asheville,” Munsey said. “And the 1940 flood on the Watauga.”
“The 1977 flood on the Nolichucky,” Yaw nodded.
“And the 1901 flood on the Nolichucky,” added Munsey.
“The paleoflood record allows you to put floods of this magnitude within the context of a long-term flood record,” Yaw said. “And we can see that floods far worse have happened in the last several hundred to several thousand years. It helps us to approach (forecasting) with sober-minded judgment.”
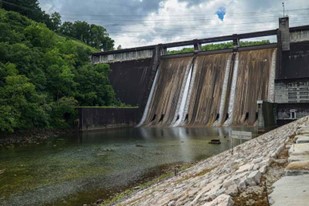
TVA’s dams are essential tools in flood prevention throughout the Tennessee River system. Seen here is Norris Dam on the Clinch River in Tennessee. (Photo by Susan Ehrenclou / TVA)
Good Decisions
Yaw and Munsey hope to continue their work with university researchers, searching the Holston and Little Tennessee banks to complete paleoflood modeling across the Tennessee River system.
“I view this as a puzzle,” Munsey said. “As we do more paleoflood studies to find more puzzle pieces on additional watersheds, … the paleoflood picture becomes clearer and clearer.”
And that means better flood risk assessment for each of TVA’s dams.
Already, they’re pleased with how the rich flood records they’ve found have improved accuracy of flood forecasting.
“We understand the flood history through the entire Holocene going back several thousand years,” Yaw said. “Five years of effort show you that in most places in the Valley region, our representation of hazards is really pretty reliable. We are making good decisions related to hydrologic risk.”